Experience
My responsabilities
- User Research
- Design system
- Wireframe / Prototype
- Collect / Refine Feedback
- Design Solution / Strategy
Deliverables
- SAS web app design
- Instructions / how to use
- Styleguide for front-end devs
- Maintainable and scalable design system
- Smartlook analisis
Important aspects
- Deadline: Improvement feature by feature
- Look: Usable, fast, easy to use
- User-level: Familiar with similar tools
- MMP: Iteration proccess
The objective
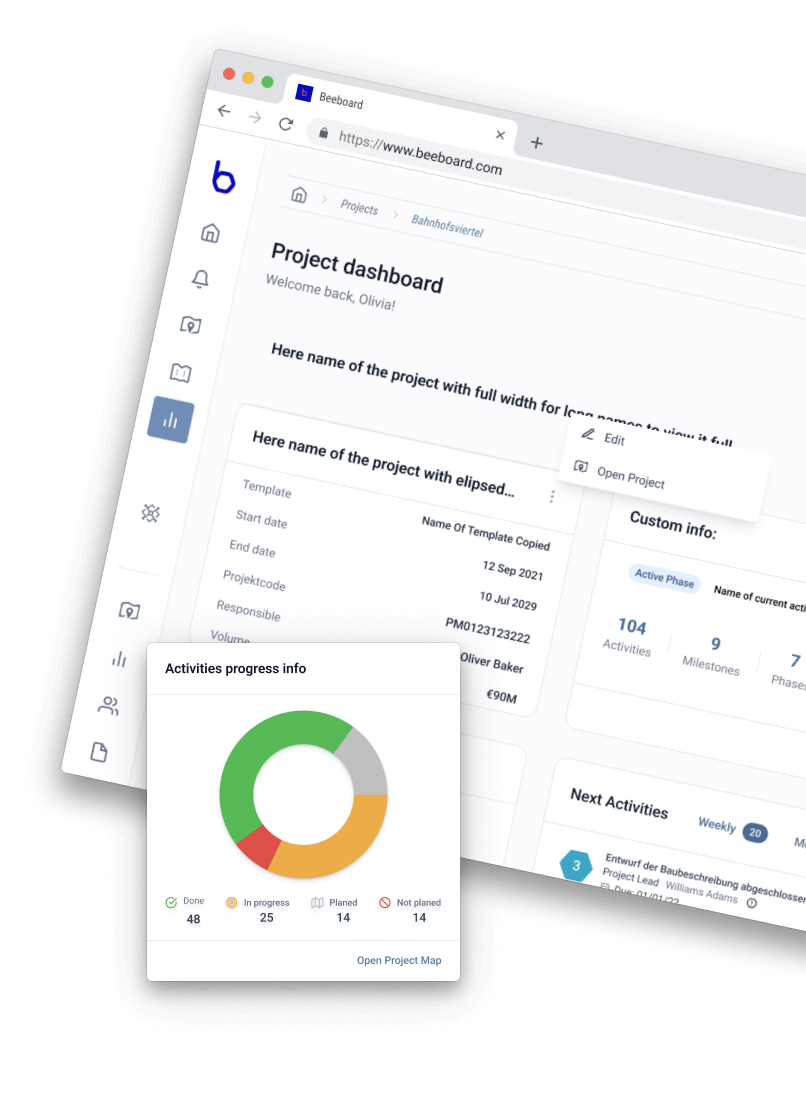
The main objective of beeboard is to transform and optimise project management in the construction sector by providing comprehensive solutions that address specific challenges and meet the needs of all participants in the construction process. The key objectives of beeboard are:
- Reduce delays and additional costs by offering tools that follow Lean principles, improving efficiency at all stages of construction projects.
- Provide visual tools and clear structures that enable users to understand and simplify construction processes, improving project execution.
- Improve collaboration and communication between all project participants, including project owners, architects and other team members, through real-time collaboration tools.
- Low monetisation of Virtual Hobbies
- Live TV broadcast with little audience appeal.
- Aims to be the leading tool that not only improves efficiency and transparency in construction projects, but also drives the adoption of modern methodologies and effective collaboration between all participants in the construction process.
The problem area
- Projects lacking efficient management, resulting in delays, additional costs and lack of transparency at project stages.
- Difficulty in visualising and understanding construction processes, leading to errors in communication and execution.
- Challenges in centralised management of resources and documents, resulting in loss of control and possible creation of data silos.
- Lack of real-time communication and decentralised collaboration between the different project participants.
- Difficulty in making rapid adjustments to project plans in the face of unforeseen challenges.
- Lack of standardisation in projects, making it difficult to replicate successful practices.
- Challenges in monitoring and achieving project milestones and objectives.
- Resistance to the adoption of new technologies in the construction sector.
The Challenge
- Implementation of project management tools that follow Lean principles, providing a clear structure and facilitating process optimisation.
- Development of a centralised interface for the efficient management of resources and documents, facilitating access and ensuring a smooth workflow.
- Real-time collaboration tools are implemented, facilitating communication between project owners, architects and other team members for more effective collaboration.
- Development of a functionality that allows the flexible adaptation of projects in real time, facilitating an agile response to unexpected situations.
- Integration of a milestone planning and target tracking function to improve visibility and goal achievement.
- Desarrollo de una interfaz fácil de usar, con capacitación integrada y elementos de gamificación para fomentar la participación y la adopción de la plataforma.
Goals
- Gain up to 30% better efficiency with a central communication tool that integrates all project members across companies and hierarchies.
- Allows you to work with your suppliers and external partners in a single collaboration tool and get everyone on the same page. All the time.
- Keep project management knowledge on the board so it doesn't get lost in the shuffle.
- Onboard new employees in the blink of an eye.
- Modern process maps
- Acceleration of processes
When gathering insights it's important to put aside your own opinions and accept what you hear and see. Here, are my sources:
stakeholders representative
Talk to stakeholders and note down their strong advice.
Usability test
Clarifying your objectives is crucial for the test's success. Which aspects of the platform are you aiming to assess? What specific questions are you seeking to address?
User interviews
Observe, listen, and engage with potential users to uncover insights.
Competitor analisis
I checked popular proyect management tools to gather opinions also proobe some free version apps to see the behavior and usability to compare.
User persona
Personal data
User data info
Gender : Male
Age: 38
Your area :Urban area with a significant construction industry presence
Current Role: Senior Project Manager at a construction firm

Jorg Edmun Smith
Alex is a seasoned UI/UX professional with 8+ years of experience in designing user interfaces for project management tools. Having previously worked in the construction industry, Alex understands the complexities and unique challenges faced by project owners, architects, and team members.
Social media
which social networks do you use
Goals
What would you like from powefans..
- Boost efficiency with advanced tools.High
- Embed sustainability in construction. Middle
- Balancing sustainability goals with traditional construction practices.Low
- Ease tech adoption in construction.High
Needs
What is important ...
- Efficiency in Project ManagementMiddle
- Reducing Waste of ResourcesMiddle
- Real-Time CollaborationHigh
- Support for StandardisationHigh
Personal Motivation
Persona’s drivers. What gives them a passion to use a product?
- Optimising project managementLow
- Adoption of Lean MethodologiesMiddle
- Have your own virtual avatarHigh
- Eliminating waste of resources, whether in terms of time, materials or capitalHigh
Frustrations
What's not to like...
- Excessive Complexity.Low
- Integration Problems.Middle
- Lack of Technical Support.High
- learning curve when adopting a new technology.High
Technology Use
Device list
Internet use
what user do on internet
Education
Shopping
Sports content
Social media
Personal bank manage
Competitor analysis
Analised the top project management tools to collect negative and possitive feedback from actuals users and try to improve on that.
User data info

Asana |

Monday |

WRIKE |
|
|
|
Overarching goal:
Transform project management by integrating lean principles, fostering efficiency, transparency, and collaboration, and eliminating resource waste for measurable impact and project success.
Emphaty map
Says
-
Users observe a multitude of tasks, stakeholders, and documents involved in project management.
-
They see opportunities for improvement in communication and coordination.
-
They may notice inefficiencies in current project management practices.
Thinks
-
Users may feel overwhelmed by the complexity of project management.
-
They might be frustrated by inefficient processes and communication gaps.
-
They may be seeking solutions to streamline their workflow and improve project outcomes.
Does
-
Users are actively searching for project management tools that meet their needs.
-
They are implementing strategies to improve project efficiency and collaboration.
-
They may be experimenting with different tools and methods to optimize their workflow.
Feals
-
They feel motivated to find tools that enhance collaboration and efficiency.
-
They have delay problems for some live sounds or challenges.
-
They may feel anxious about meeting project deadlines and budgets.
POV - Point of View
In the face of the physical constraints and complexity of construction management, beeboard emerges as the end-to-end project management solution, unlocking efficiency and real-time collaboration to overcome obstacles and optimise project execution in an agile and transparent manner.

FanMaster23's PowerFans Journey:
-
Integration of beeboard into Workflow
Emma recently integrated beeboard into her workflow, recognizing its potential to drive efficiency and eliminate waste in construction project management. By incorporating beeboard, Emma aims to streamline processes and optimize project outcomes.
-
Accessing a User-Friendly Dashboard:
Each day, Emma begins by accessing beeboard's user-friendly dashboard, where she can easily navigate project timelines and key milestones. This intuitive interface allows her to set and track project goals effortlessly, providing a clear overview of project progress.
-
Utilizing Visualization Features:
Emma utilizes beeboard's visualization features to map out construction processes, identifying bottlenecks and optimizing workflows for improved project timelines. These visual representations aid in understanding complex processes and making informed decisions.
-
Streamlined Communication:
With beeboard's real-time collaboration tools, communication among project stakeholders is streamlined, ensuring seamless coordination. Emma can communicate effectively with team members, architects, and contractors, facilitating swift decision-making and problem-solving.
-
Centralized Resource and Document Management:
beeboard centralizes crucial project information, including resources and documents, preventing data silos and facilitating easy access for the entire project team. Emma can efficiently manage and organize project documentation, ensuring everyone has access to the information they need.
-
Overcoming Resistance:
Initially facing resistance from team members unfamiliar with technology adoption, Emma leverages beeboard's support resources to guide them through the platform. The adaptability and simplicity of beeboard gradually win over the team, fostering a collaborative environment.
-
Reduction in Resource Waste:
Emma notes a significant reduction in resource waste thanks to beeboard's emphasis on Lean methodologies. By standardizing project management processes, beeboard ensures more consistent and efficient project deliveries, ultimately leading to reduced waste and improved efficiency..
-
Standardized Project Management Processes:
Beeboard's adaptability ensures that project management processes are standardized, contributing to consistency and efficiency. Emma can rely on beeboard to streamline processes and optimize project outcomes, ensuring successful and timely project delivery.
-
Reflection on Positive Impact:
Approaching project completion, Emma reflects on the positive impact of beeboard. The project is on track, with improved efficiency, reduced waste, and enhanced collaboration. Emma credits beeboard for transforming project management and ensuring successful and timely project delivery.
Quantitative research
I have used Smartlook and optimal workshop to create different events, and also I have carried out a usability test.
Conduct an Activity Search:
-
Instructions
Instructions: Use the search bar to find the activity with the name "Monthly Report". Click on the activity once found.
-
Quantitative Metric
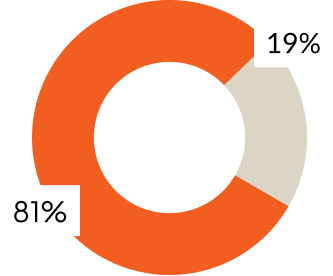
Average time to complete the search. (2min)
Users who have successfully completed the task in less than 2 min.
YES
NO
Conduct an Activity Search:
-
Instructions
Instructions: Edit the title of the activity "Nº18". Make changes to the responsible person and save the modification.
-
Quantitative Metric
Average time to complete the search. (3min)
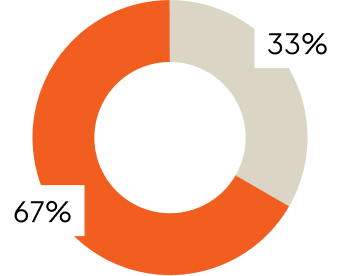
Users who have successfully completed the task in less than 3 min.
YES
NO
Conduct an Activity Search:
-
Instructions
Instructions: Add two sub-activities to the activity "Project Planning". Assign responsibilities and start dates.
-
Quantitative Metric
Quantitative Metric: Average time to complete the task (6min)
Users who have successfully completed the task in less than 6 min.
YES
NO
Conduct an Activity Search:
-
Instructions
Instructions: Rearrange the completion criteria of the "Project Execution" activity to reflect the appropriate sequence using dates. Save the changes.
-
Quantitative Metric
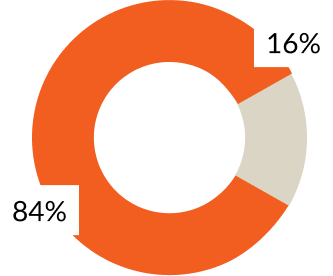
Quantitative Metric: Average time to organise a sub-activity ( 6min)
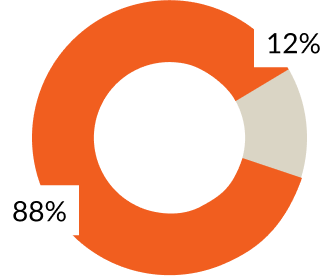
Users who have successfully completed the task in less than 6 min.
YES
NO
Conduct an Activity Search:
-
Instructions
Instructions: Access the change history of the "Design Review" activity. View the last three changes made.
-
Quantitative Metric
Quantitative Metric: Average time to access history. (4 min)
Users who have successfully completed the task in less than 4 min.
YES
NO
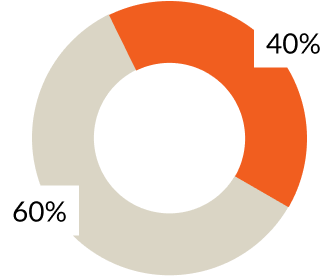
Key Insight Derived
Activity Editing Efficiency:
-
Key Insight: The task of editing activities was completed quickly, with an average time of 2min. This indicates overall efficiency in the ability of users to make changes to activity descriptions.
Add Sub-Activities:
-
Key Insight: Adding sub-activities required, on average, with an average time of 4 min . The action was performed relatively quickly, but the number of clicks could indicate the need for a more straightforward option or a more intuitive interface for this task.
Organisation of Sub-Activities:
-
Key Insight: Reorganisation of sub-activities took an average time of 4 min . This process was efficient, but could be improved .
Accessing Change History:
-
Key Insight: The task of accessing the change history showed acceptable speed, with an average time of 6 min. This suggests that users find the function and can review previous changes efficiently. The icon can be changed to better recogniment
Activity Search:
-
Key Insight: The activity search was completed in an average time of 1min 12 seconds. The search bar proved to be an effective tool for locating specific activities, contributing to user efficiency.
Solutions
Solutions
-
Implement keyboard shortcuts for quick editing of activities, further reducing the time needed.
-
Adding text to add sub-activities will help the user to recognise that functionality more quickly.
-
Implement an auto-complete function in the search bar for faster results.
-
Displaying the list of subtasks in date order will help the user to find the most urgent.
-
Add animations or colour changes to clearly indicate when changes have been successfully saved.
-
Optimise drag-and-drop response by providing visual indicators and a more responsive interface..
General Expectations:
Continuous Improvement:
-
Continuous improvement in usability is expected as solutions are implemented and additional user feedback is gathered.
Positive Feedback:
-
Positive feedback from users is anticipated, especially in areas where their concerns have been addressed and improvements have been implemented.
Improved Quantitative Metrics:
-
Expected to see quantitative improvements in key metrics such as task times, number of clicks and overall user satisfaction.
Improved User Retention:
-
TImplementing solutions that improve the user experience should contribute to higher user retention and increased loyalty to the platform.
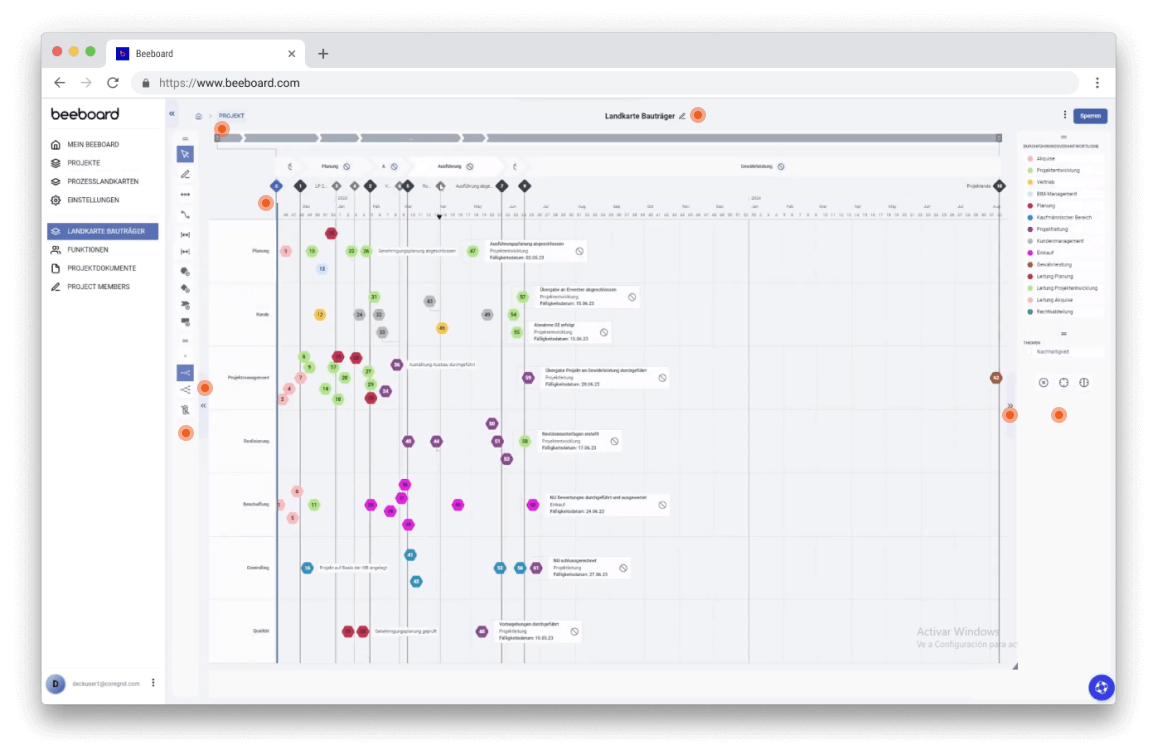
Map refactoring
You can play inside to see the behaviour
New Sidebar
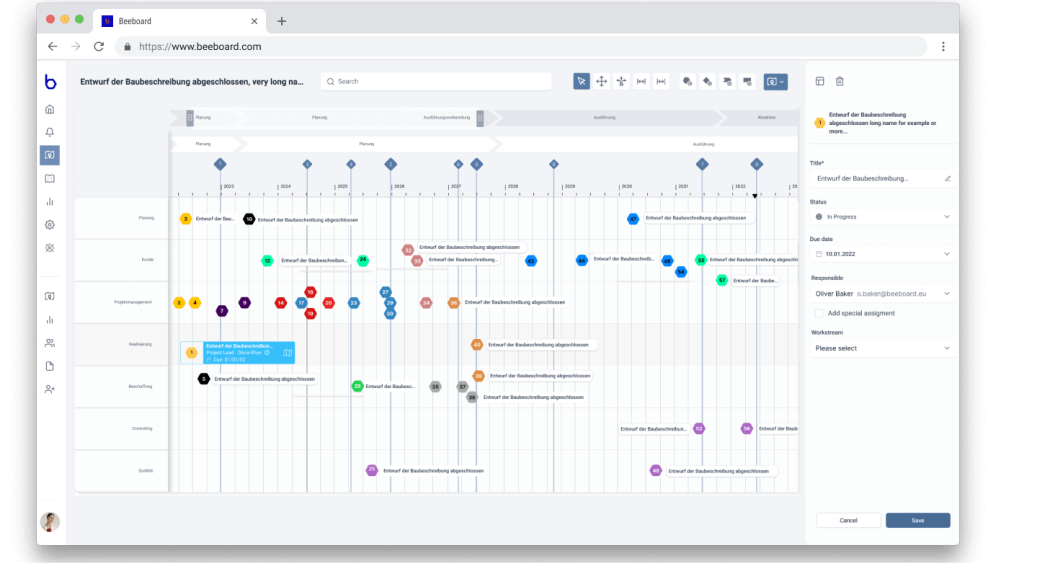
This improves efficiency by allowing users to perform activity-specific actions more quickly and directly, while keeping the focus on the main map view. It also facilitates smooth interaction by avoiding unnecessary interruptions in navigation. Enhance user experience by introducing an individual toolbar for activities on the map, providing efficient options like editing, navigating to detail pages, viewing predecessors and successors, copying to the template library, accessing history details, and deleting. Utilize navigation tabs for quicker editing or adding of sub-activities. The new sidebar can be extensible allows users to make multiple changes in one place, providing options to save or cancel, streamlining the workflow for improved efficiency and usability.
Top navigation/ Toolbar
Integrating a search bar, project title, and toolbar into the map interface enhances navigation efficiency, provides essential project context, offers enhanced functionality, ensures a user-friendly interface, and allows for a customizable experience tailored to user needs.
Sketching ideas & solutions
Created the first sketches to produce some ideas. To identify issues, user-flows and try to come up with solutions.
Wireframes
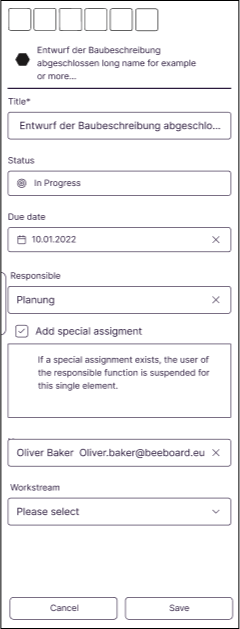
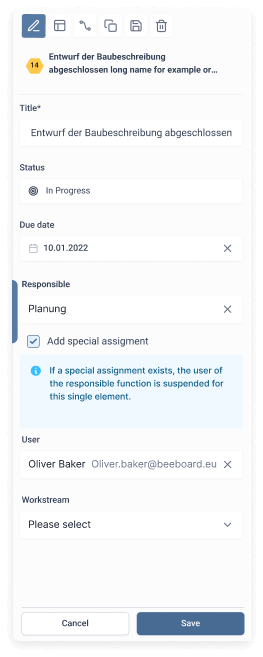
Sidebar activity without sub activities
Top Menu Actions:
- By incorporating top menu actions directly related to the selected activity on the map, users have quick access to essential functionalities without navigating to other sections. This minimizes the number of clicks needed for common actions.
Title Display:
- Displaying the title of the selected activity along with its unique identifier provides users with clear context and identification, reducing cognitive load.
Form to edit:
- Dedicated section for editing the selected activity in the same view minimize the need for users to navigate away, maintaining a focused and uninterrupted workflow.
Actions buttons
- Requiring confirmation buttons to appear only when changes are made ensures that users are prompted to save or discard modifications, reducing the risk of accidental data loss. This approach enhances user control and provides a clear feedback loop.
Not edited
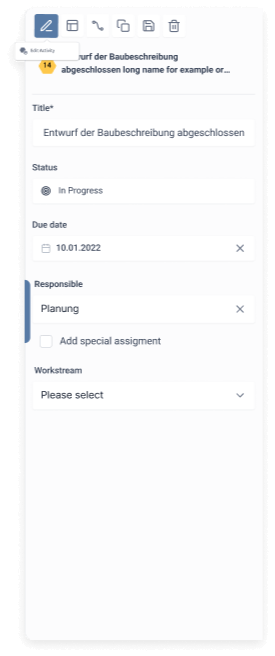
Edited
Wireframes
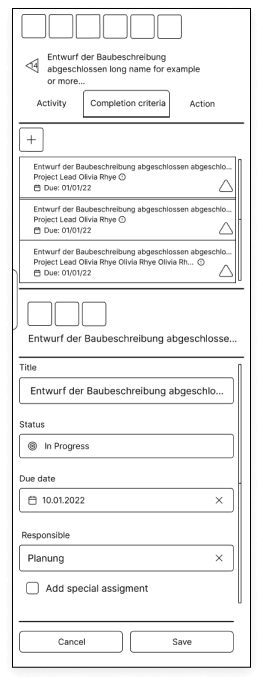
Sidebar with sub-activities
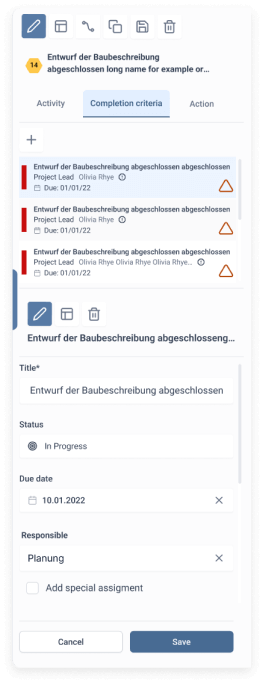
Tab Navigation Menu:
- Including a tab navigation menu for selecting different aspects of the activity, such as completion criteria and actions, ensures that users can efficiently switch between relevant information without leaving the main view.
List of Sub-activities:
- Presenting a list of subactivities within the sidebar allows users to easily navigate and select specific components, avoiding the need to switch between different pages or sections.
Create new sub-activities
- Dedicated button to create a new sub-activity without leaving the map, it will open a new section below to manage this action.
Sub-actibities menu option
- By incorporating top menu actions directly related to the selected sub-activity in the listing, users have quick access to essential functionalities without having to navigate to other sections. This minimises the number of clicks required for common actions.
Sub-activity selected
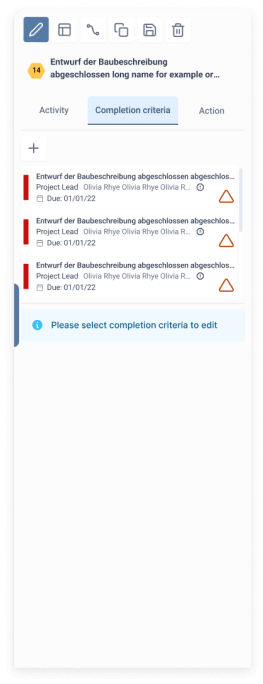
Sub-activity not selected
Wireframes
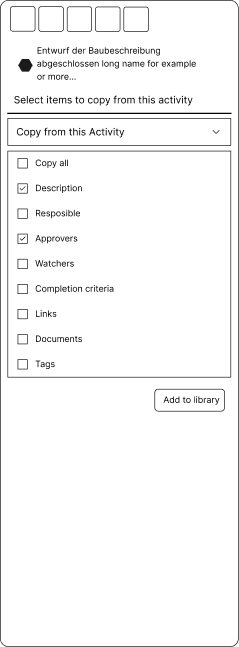
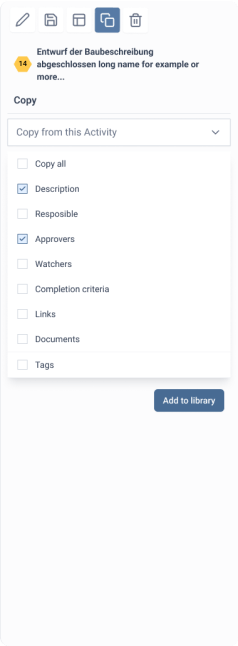
Integrating a copy activity mode
Efficiency in Activity Replication:
- By allowing users to copy specific elements of an activity, such as title, description, and responsible parties, they can quickly replicate similar tasks or activities across different projects or templates. This saves time and effort in manually recreating similar tasks from scratch.
Consistency and Standardization:
- The ability to copy completion criteria, links, and documents ensures consistency and standardization across activities within the platform. Users can maintain uniformity in defining completion requirements and accessing relevant resources, leading to improved project management practices.
Enhanced Collaboration and Accountability:
- Integrating approvers, watchers, and tags into the copy activity mode promotes collaboration and accountability within project teams. Users can easily designate approvers and watchers for copied activities, ensuring timely reviews and keeping relevant stakeholders informed. Tags facilitate categorization and organization of activities, making it easier to manage and track tasks.
Reuse of Templates and Best Practices:
- The option to add tags to a library of activities for reuse in other projects or templates promotes the reuse of proven templates and best practices. Users can create standardized activity templates with predefined tags, allowing for consistent project execution and leveraging successful strategies across various projects.
Streamlined Documentation Management:
- Including links to central documents without the input part streamlines documentation management within the platform. Users can reference relevant documents directly from the activity without duplicating or manually managing document attachments, reducing clutter and ensuring easy access to essential resources.
Copy mode
Wireframes

Activity History
Facilitates Retrospective Navigation:
- With the activity history in the sidebar, users can easily scroll back to review previous actions taken on the platform. This allows them to track their progress and return to specific actions when necessary, providing a smoother and more efficient user experience.
Increases Usability:
- By providing users with the ability to see in detail the previous actions taken, the design enhances usability by allowing them to better understand the context of their previous work. This helps reduce the likelihood of errors and facilitates the correction of any incorrect actions.
Improves User Experience:
- The ability to undo and redo previous actions is a highly valued feature in user interfaces. By adding this functionality to the sidebar, the platform's design becomes more robust and satisfying for users, enhancing their overall experience.
Encourages Experimentation:
- Knowing they can revert any action taken gives users the confidence to experiment and try out new features without fear of making irreversible mistakes. This encourages exploration and discovery in the platform, which can lead to increased engagement and commitment.
History list

History detail

Wireframes
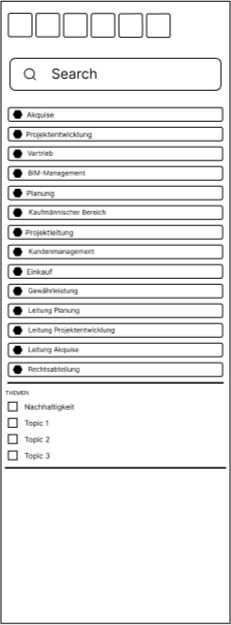
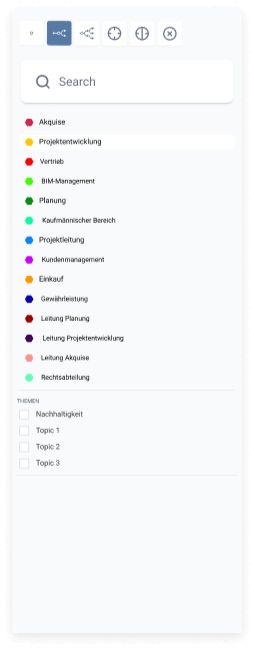
Sidebar Filter activity
Visual Clarity and Organization:
- The top menu filters and function-based colors contribute to a visually organized map, reducing cognitive load and improving overall clarity.
Efficient Search and Retrieval:
- The secondary search bar and filters enhance the efficiency of finding activities, providing users with multiple pathways to locate information quickly.
Customization and Personalization:
- Tags, topics, and function-based filters allow users to customize their view, tailoring the map to their specific needs. This level of personalization enhances the user experience by adapting the interface to individual preferences.
Reduced Visual Clutter:
- The opacity adjustment and filtering options help reduce visual clutter on the map, ensuring that users can focus on the most relevant activities without distraction.
Intuitive Navigation:
- The combination of search bars, filters, and color-coded functions promotes an intuitive navigation experience, making it easier for users to interact with the map based on their unique requirements.
Filter sidebar design
